Guided Vis
In the second semester of my master studies at the University of Applied Sciences in St.Pölten I had the pleasure to support the work on a project for the research group Media Computing. The goal of this project was to create a guided, interactive step-by-step instruction that explains how a data visualization is constructed.
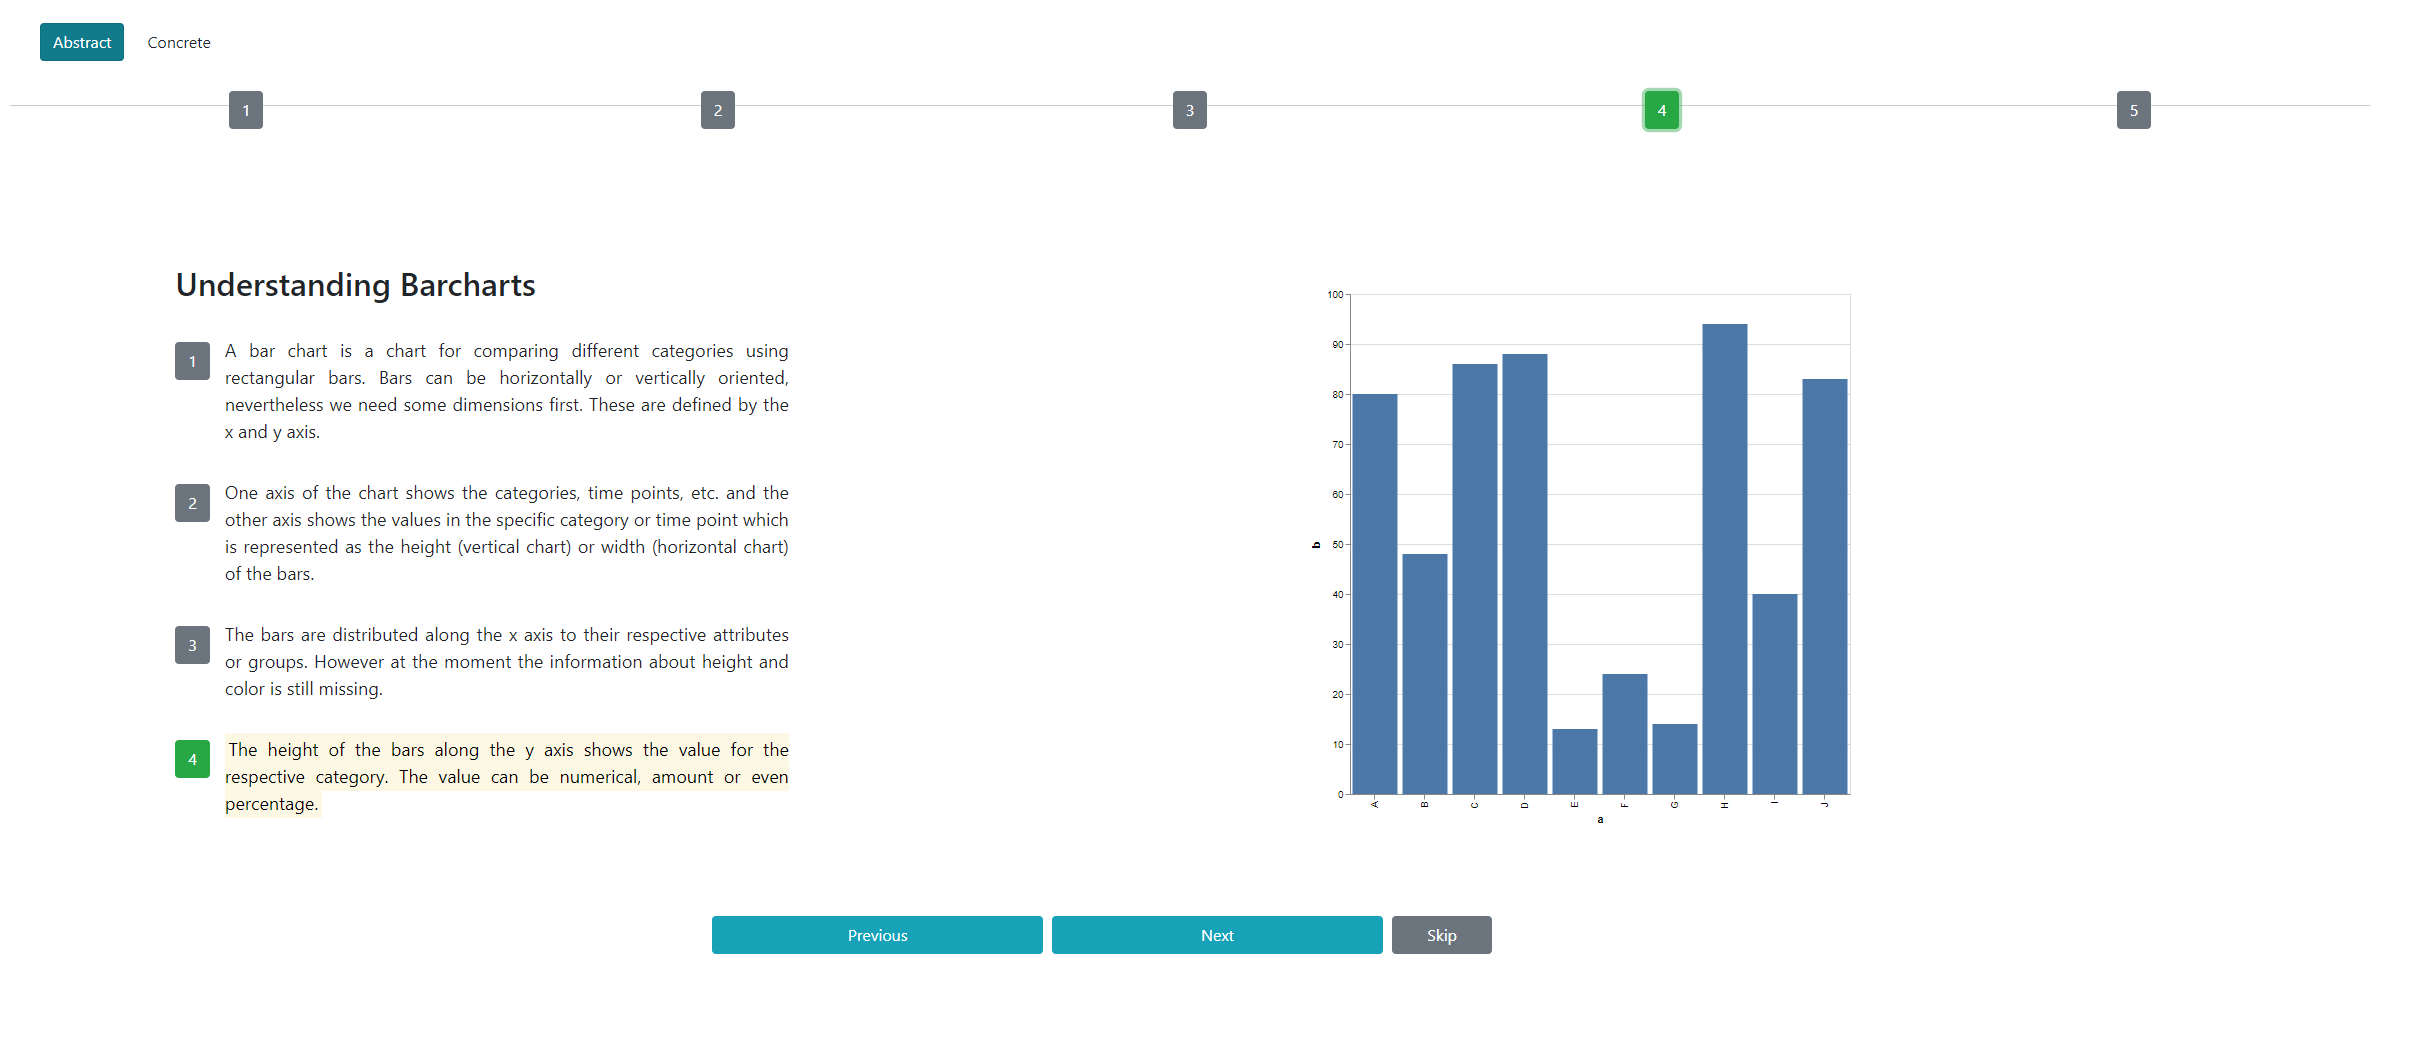
To achieve this, I created a web application with the JavaScript framework React, that shows and explains the structure of a bar chart in 5 single consecutive steps. The application includes 2 modes, which contain different representations and explanations of the data.
The "Abstract" mode shows a bar chart based on abstract data, while the "Concrete" mode uses the results of the 2019 EU elections as a basis for the visualization. In both views, 5 different steps, which are interactive and selectable, show different phases of the visualization.