VisOnboarding
VisOnboarding is a proof-of-concept prototype that was developed as part of my master thesis. It is in the context of the scientific examination of the topics data visualization literacy assessment and user onboarding.
The prototype specifically aims to answer the established research question: How can the assessment of the users current state of knowledge influence the design for data visualization teaching concepts?
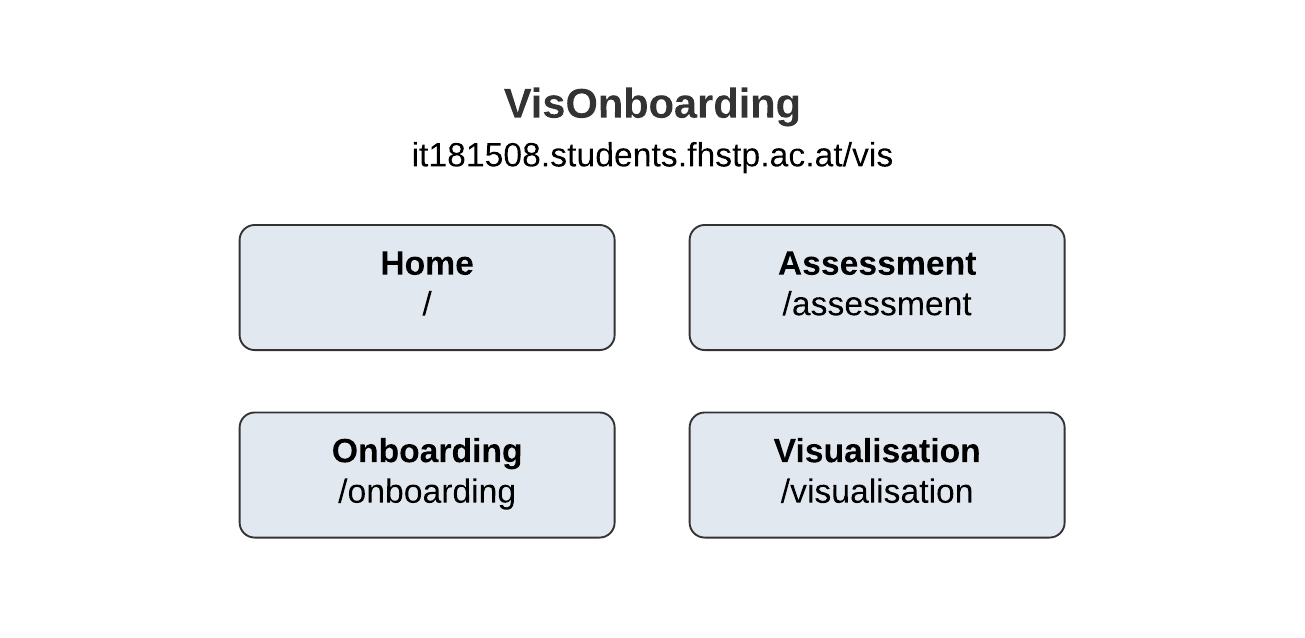
VisOnboarding represents a way of assessing visualization literacy and using the gathered results to provide a user adapted onboarding tour for a specific data visualization. Therefore, it consists of three defined phases: Assessment, Onboarding and Visualisation, with each of them following the other. As a whole, these three phases are understood as an example of "visualization onboarding".
The phase Visualisation, which follows after completing the phases Assessment and Onboarding, shows a Gantt chart illustrating time-oriented data. The intermediate phase Onboarding uses different visual elements and explanatory texts depending on the needs of the user. These user needs serve as a requirement for generating the onboarding process and are defined by the outcome of the preceding Assessment phase. A user who did not perform well during the Assessment would receive extensive onboarding, while a user who was assessed as having an advanced level of knowledge would only receive a minimum of explanation.
For the advanced user classified in a higher visualization literacy level, the explanation focuses on the complex properties and characteristics of the visualization and a basic understanding for Gantt charts and its characteristics in general is assumed to be present. In contrast, the low level user will be introduced to the Gantt chart visualization in a very detailed and comprehensive way. Within the framework of this particular onboarding process, a general focus on Gantt Charts is presented before the specific features of the given visualization are explained. The onboarding ensures in both cases, that the user has the necessary information and skills to interact and correctly interpret the subsequent Gantt chart visualization.
This prototype serves as an example to demonstrate the need for the onboarding of data visualizations and presents a way of visualization onboarding that utilizes an assessed visualization literacy.
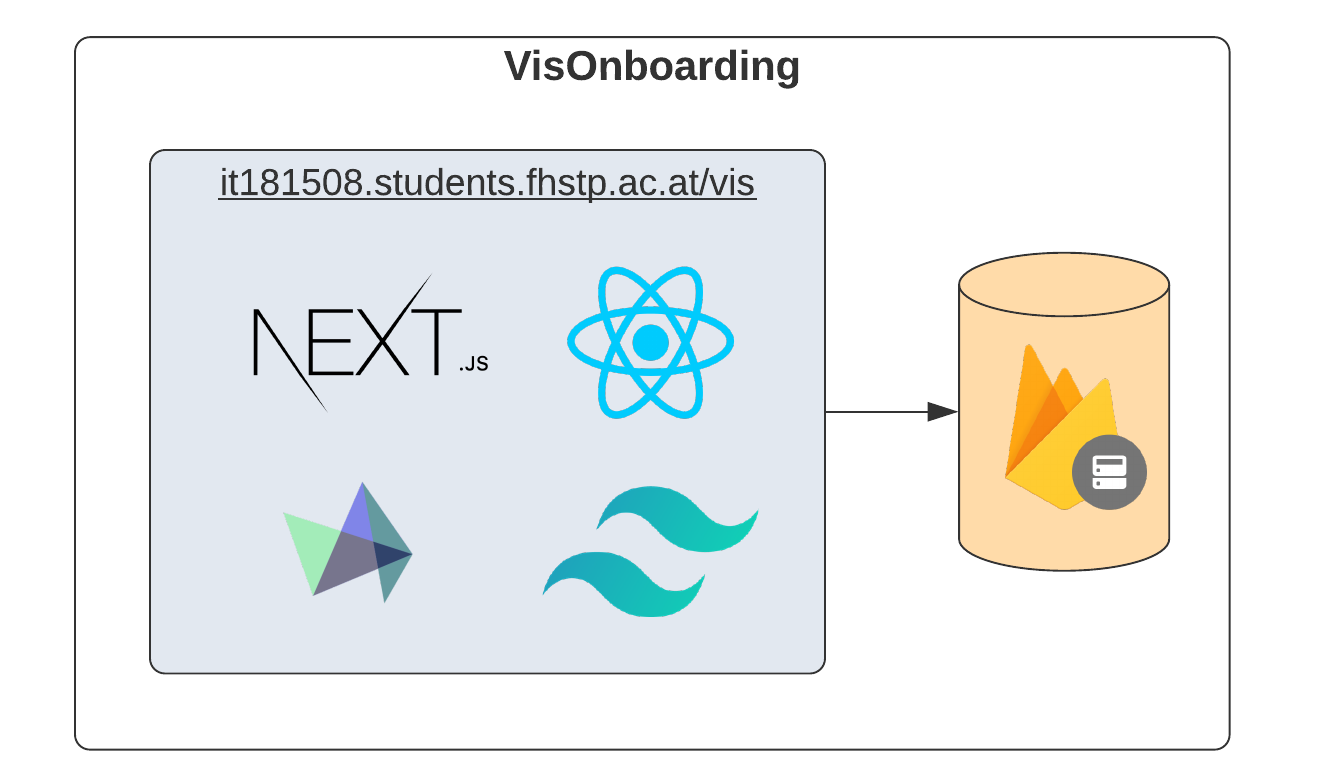
VisOnboarding was implemented as an easily accessible application, that runs in a web environment reachable on a public URL. The focus of VisOnboarding lies on usability and a reduced design, emphasizing the core functionalities, without distracting from them. The application does not require complex logic, which would require higher computing power and server-side processing. For this reason VisOnboarding is implemented as a pure client-side application. Data is stored in a de-centralized database only to enable the realization of user tests.
The central framework that VisOnboarding is Next,js. To create the various charts, the visualization library Highcharts.js was used. Finally, the styling and design was done with the framework tailwindcss.